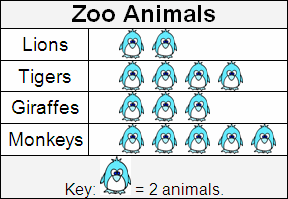
| Skill 9E Problem Solving: Using a Pictograph A pictograph (taken from the word picture) is nothing more than a graph that uses visual pictures to represent something. Sometimes the pictures are all the same (which can become confusing) as they are only used to represent a number. Therefore, students must be reminded to look carefully at the text description to the left of the picture to know what is actually being counted. Ethan's class visited the zoo and recorded
how many lions, tigers, giraffes and monkeys live in the zoo. They put the results in the
pictograph below. |
||||||||||||||||||||||||||||||||||||||||||||||||||||||||
|
||||||||||||||||||||||||||||||||||||||||||||||||||||||||
| Your job is to complete the frequency table below by using the information given in the pictograph. Choose your answers from the right of the frequency table. | ||||||||||||||||||||||||||||||||||||||||||||||||||||||||
|
||||||||||||||||||||||||||||||||||||||||||||||||||||||||
|
||||||||||||||||||||||||||||||||||||||||||||||||||||||||